Visualizing the computation of 2-adic integers
The Maclaurin series for \(\frac{1}{1-x}\) is \(1 + x + x^2 + x^3 + \cdots\).
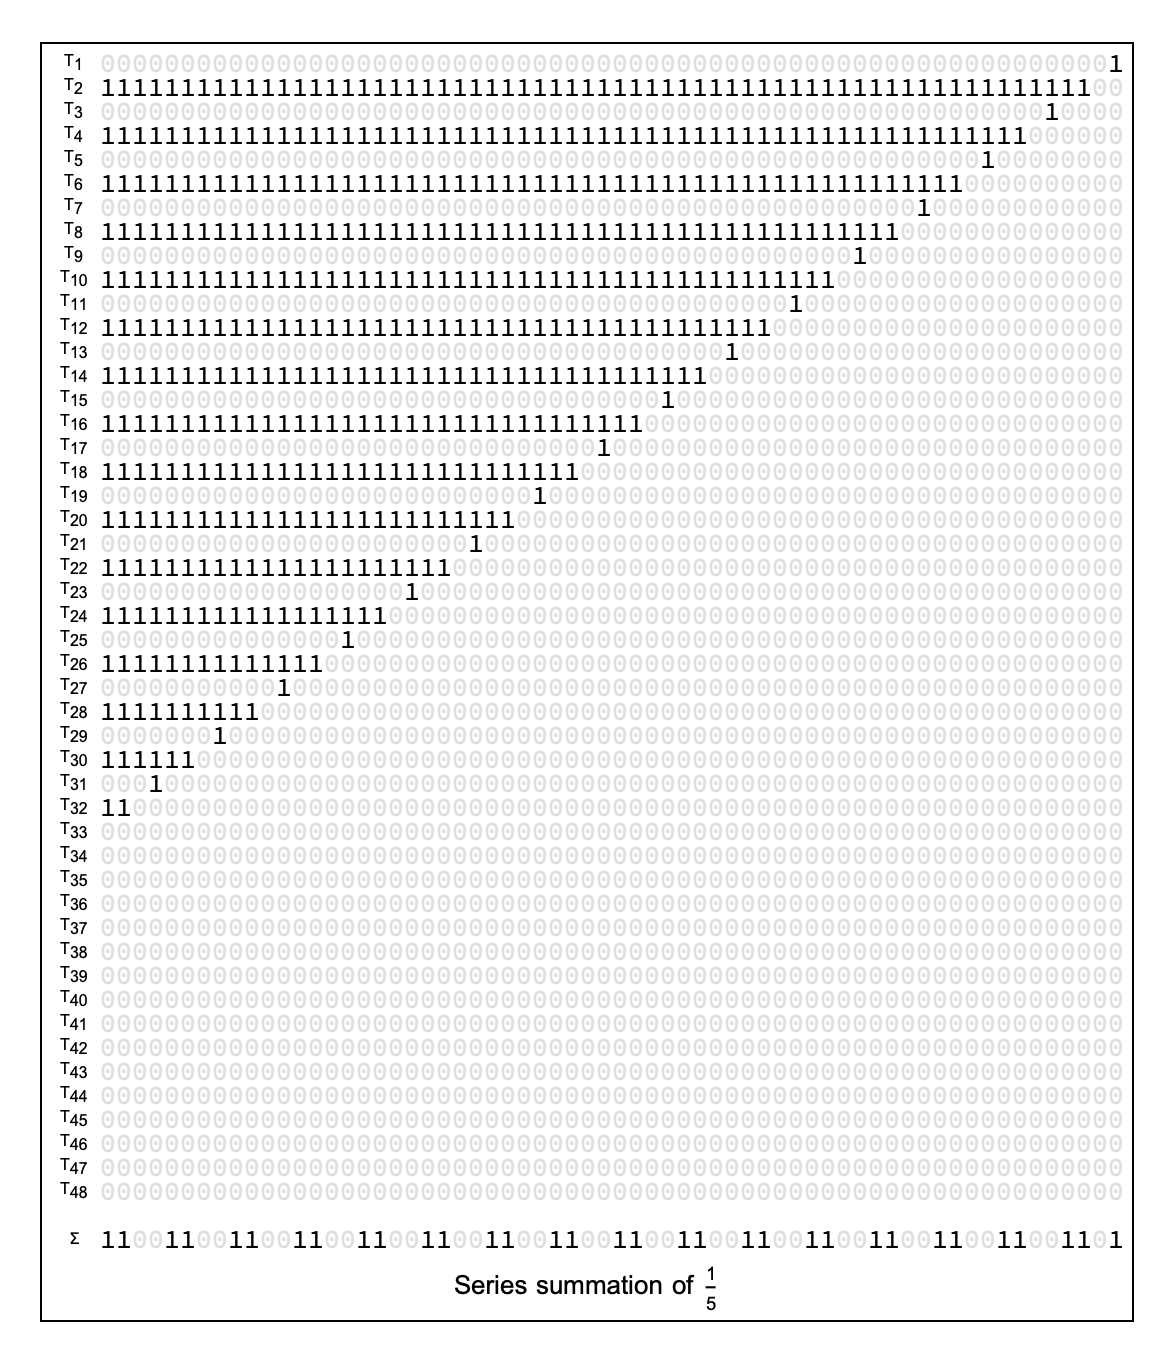
So fractions such as \(\frac{1}{5}\) may be computed as \(\frac{1}{5} = 1 + -4 + (-4)^2 + (-4)^3 \cdots = 1 - 4 + 16 - 64 \cdots\).
This sum does not converge in the reals, but it does converge in the 2-adics.
This can be visualized by placing the binary digits of each term in a grid as if we were summing them with the traditional method.

In the above graphic, \(T_1\) is \(1\), \(T_2\) is \(-4\), \(T_3\) is \(16\), \(T_4\) is \(-64\), and so on.
At the bottom, you can see that limit of the summation is \(\ldots00110011001101\), and indeed this is \(\frac{1}{5}\) written in 2-adic notation.
We can visualize other fractions as well.
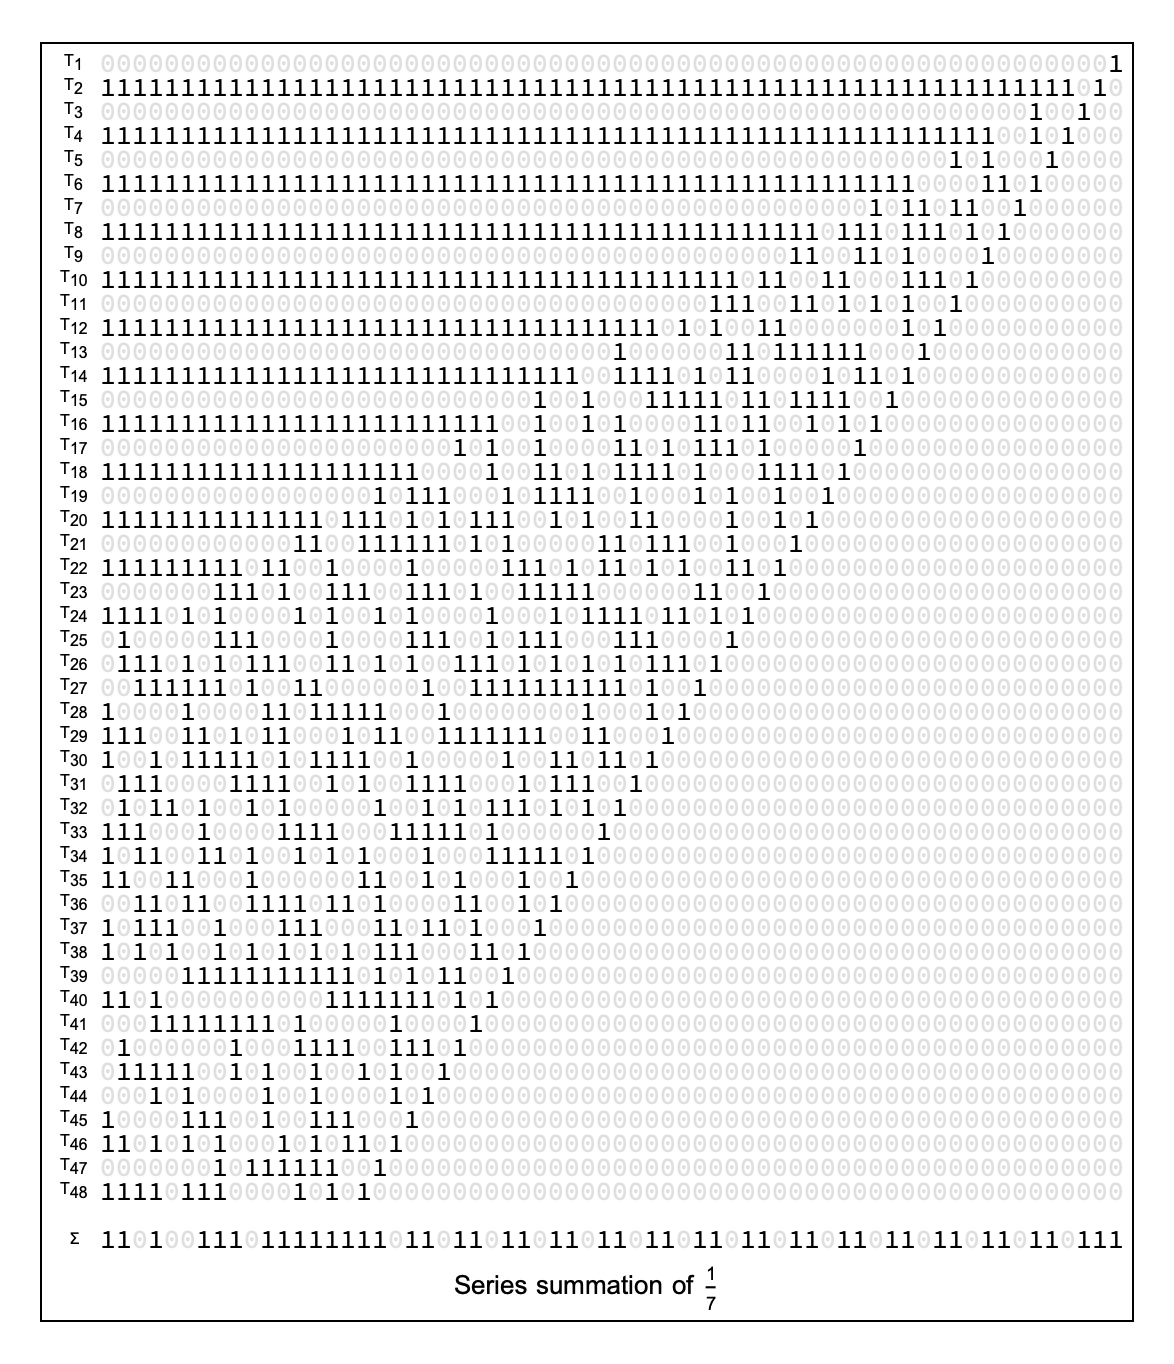
Here is the visualization for \(\frac{1}{7}\):

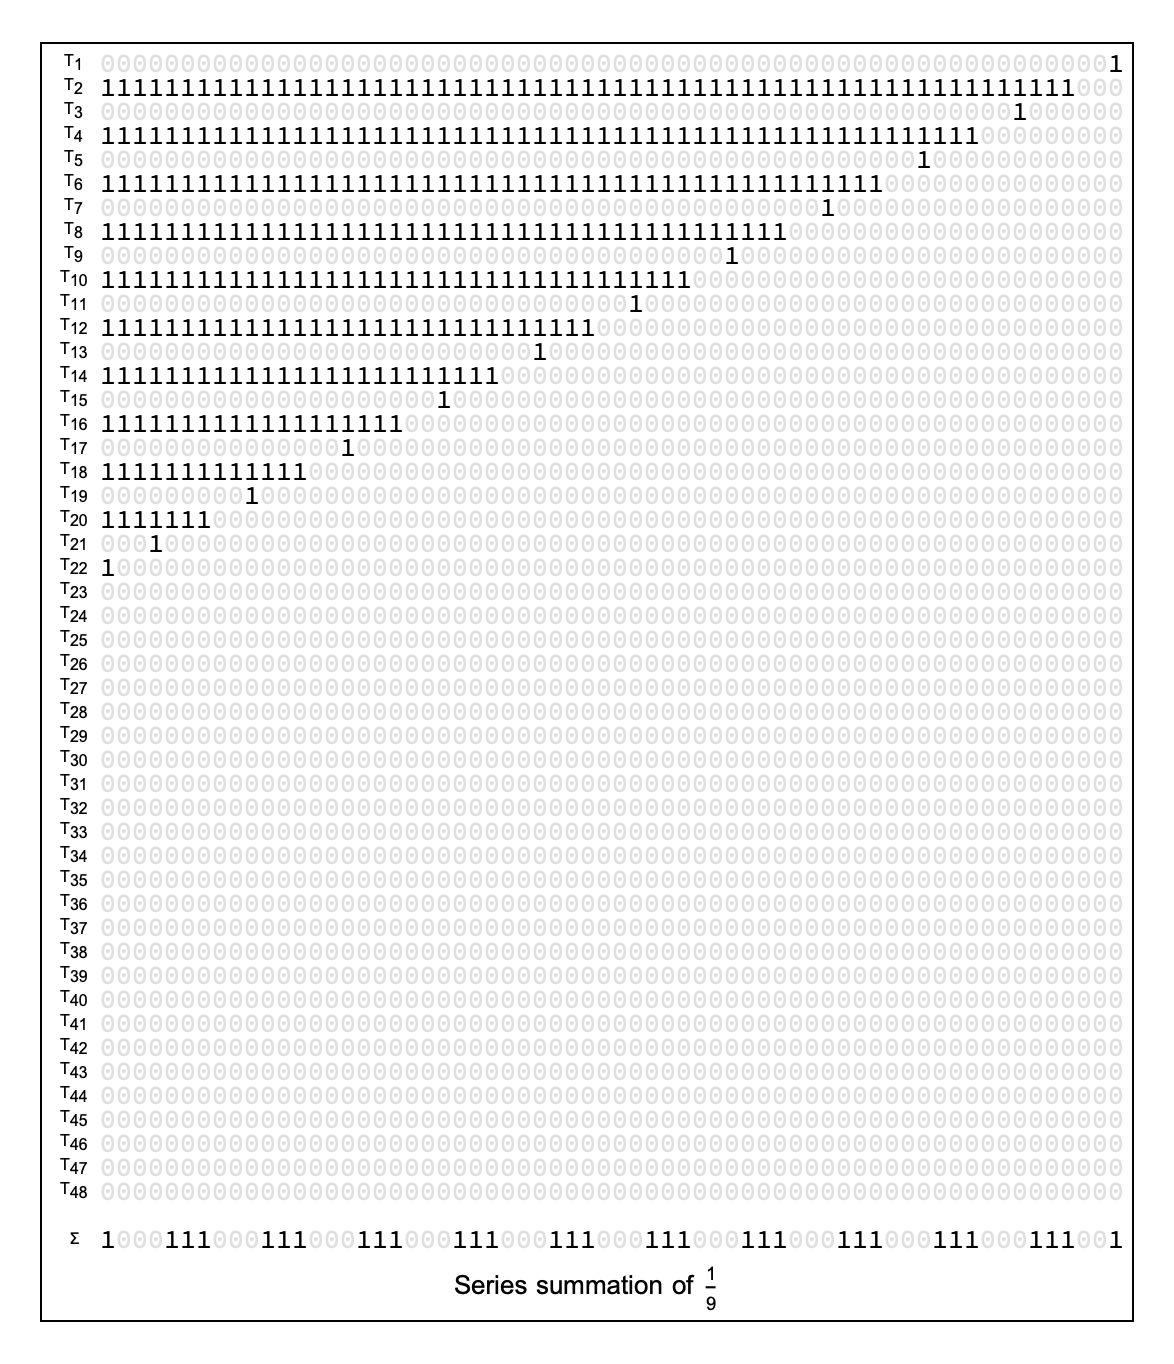
And here is the visualization for \(\frac{1}{9}\):

It is interesting that the visualizations for \(\frac{1}{5}\) and \(\frac{1}{9}\) show simple patterns in the fields of bits, but the bit field for \(\frac{1}{7}\) shows a complicated pattern and a divergence of the 2 frontiers of the summation.
Nevertheless, the limit of the summation of \(\frac{1}{7}\) is still a simple pattern in 2-adic notation.
Also checkout Database of 2-adic Integers.